Clustering methods
Contents
Clustering methods#
Clustergram offers three backends for the computation - scikit-learn and scipy which use CPU and RAPIDS.AI cuML, which uses GPU. Note that all are optional dependencies but you will need at least one of them to generate clustergram.
Scikit-learn, SciPy and RAPIDS cuML backends#
Let’s load the data on Palmer penguins dataset. See the Introduction for its overview.
import seaborn
from sklearn.preprocessing import scale
from clustergram import Clustergram

df = seaborn.load_dataset('penguins')
data = scale(df.drop(columns=['species', 'island', 'sex']).dropna())

seaborn.set(style='whitegrid')
Using scikit-learn (default):
cgram = Clustergram(range(1, 8), n_init=10, backend="sklearn")
cgram.fit(data)
K=1 skipped. Mean computed from data directly.
K=2 fitted in 0.030909299850463867 seconds.
K=3 fitted in 0.01229095458984375 seconds.
K=4 fitted in 0.014159917831420898 seconds.
K=5 fitted in 0.017248868942260742 seconds.
K=6 fitted in 0.01998162269592285 seconds.
K=7 fitted in 0.02288961410522461 seconds.
Using cuML:
cgram = Clustergram(range(1, 8), backend='cuML')
cgram.fit(data)
Show code cell output
---------------------------------------------------------------------------
ModuleNotFoundError                       Traceback (most recent call last)
File ~/checkouts/readthedocs.org/user_builds/clustergram/conda/v0.7.0/lib/python3.11/site-packages/clustergram/clustergram.py:168, in Clustergram.__init__(self, k_range, backend, method, verbose, **kwargs)
    167 try:
--> 168     import cudf
    169 except (ImportError, ModuleNotFoundError) as e:

ModuleNotFoundError: No module named 'cudf'

The above exception was the direct cause of the following exception:

ImportError                               Traceback (most recent call last)
Cell In[3], line 1
----> 1 cgram = Clustergram(range(1, 8), backend='cuML')
      2 cgram.fit(data)

File ~/checkouts/readthedocs.org/user_builds/clustergram/conda/v0.7.0/lib/python3.11/site-packages/clustergram/clustergram.py:170, in Clustergram.__init__(self, k_range, backend, method, verbose, **kwargs)
    168     import cudf
    169 except (ImportError, ModuleNotFoundError) as e:
--> 170     raise ImportError(
    171         "cuML, cuDF and cupy packages are required to use `cuML` backend."
    172     ) from e
    174 self.plot_data = cudf.DataFrame()
    175 self.plot_data_pca = defaultdict(cudf.DataFrame)

ImportError: cuML, cuDF and cupy packages are required to use `cuML` backend.
cgram.plot();
data can be all data types supported by the selected backend (including cudf.DataFrame or cupy.ndarray with cuML backend).
Supported methods#
Clustergram currently supports K-Means, Mini Batch K-Means, Gaussian Mixture Model and SciPy’s hierarchical clustering methods. Note tha GMM and Mini Batch K-Means are supported only for scikit-learn backend and hierarchical methods are supported only for scipy backend.
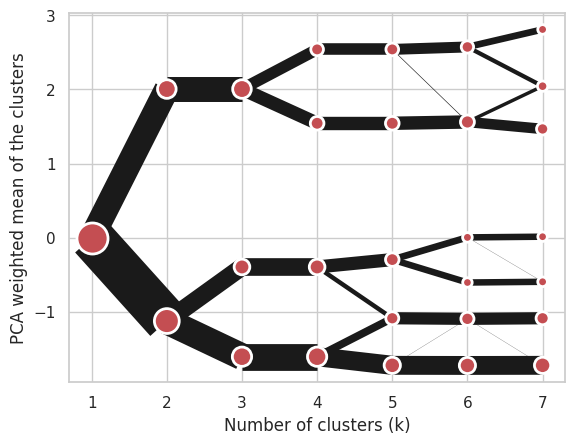
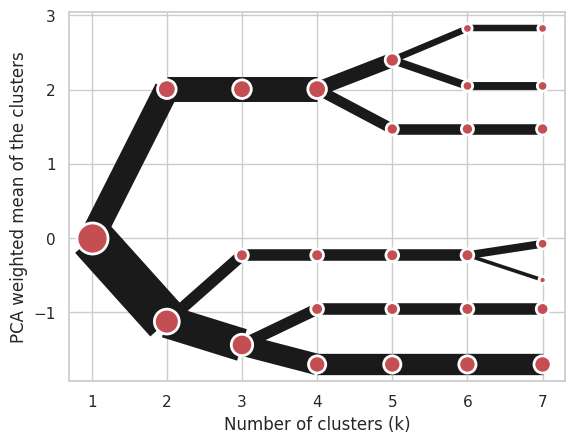
Using K-Means (default):
cgram = Clustergram(range(1, 8), n_init=10, method='kmeans')
cgram.fit(data)
cgram.plot();
K=1 skipped. Mean computed from data directly.
K=2 fitted in 0.02577805519104004 seconds.
K=3 fitted in 0.011726617813110352 seconds.
K=4 fitted in 0.015209674835205078 seconds.
K=5 fitted in 0.018609046936035156 seconds.
K=6 fitted in 0.021577119827270508 seconds.
K=7 fitted in 0.022851228713989258 seconds.

Using Mini Batch K-Means, which can provide significant speedup over K-Means:
cgram = Clustergram(range(1, 8), n_init=10, method='minibatchkmeans', batch_size=100)
cgram.fit(data)
cgram.plot();
K=1 skipped. Mean computed from data directly.
K=2 fitted in 0.011932611465454102 seconds.
K=3 fitted in 0.011293172836303711 seconds.
K=4 fitted in 0.012568473815917969 seconds.
K=5 fitted in 0.015702247619628906 seconds.
K=6 fitted in 0.017119407653808594 seconds.
K=7 fitted in 0.0191495418548584 seconds.
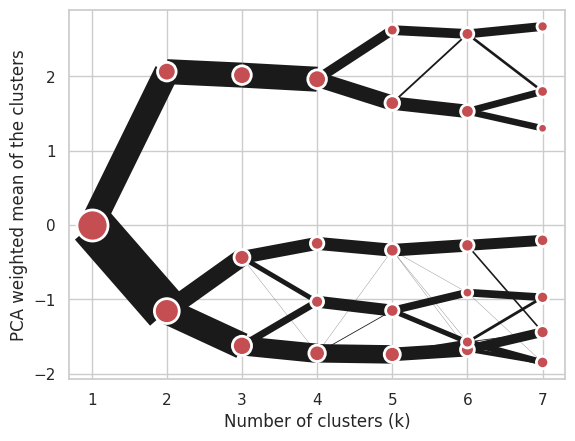
Using Gaussian Mixture Model:
cgram = Clustergram(range(1, 8), method='gmm')
cgram.fit(data)
cgram.plot();
K=1 fitted in 0.010293722152709961 seconds.
K=2 fitted in 0.014506340026855469 seconds.
K=3 fitted in 0.027019023895263672 seconds.
K=4 fitted in 0.021122455596923828 seconds.
K=5 fitted in 0.02177286148071289 seconds.
K=6 fitted in 0.02173924446105957 seconds.
K=7 fitted in 0.030631065368652344 seconds.
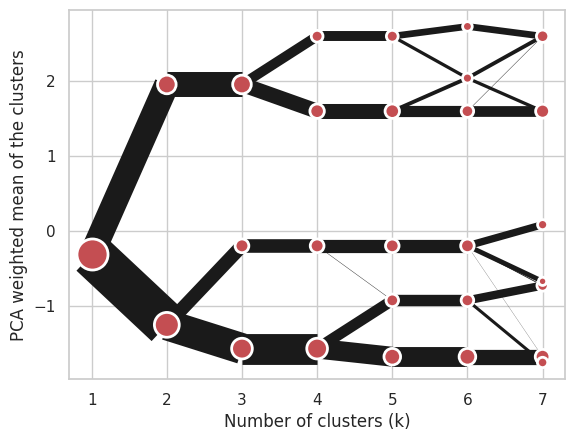
Using Ward’s hierarchical clustering:
cgram = Clustergram(range(1, 8), method='hierarchical', linkage='ward')
cgram.fit(data)
cgram.plot();
Manual input#
Alternatively, you can create clustergram using from_data or from_centers methods based on alternative clustering algorithms.
Using Clustergram.from_data which creates cluster centers as mean or median values:
import numpy
import pandas

data = numpy.array([[-1, -1, 0, 10], [1, 1, 10, 2], [0, 0, 20, 4]])
labels = pandas.DataFrame({1: [0, 0, 0], 2: [0, 0, 1], 3: [0, 2, 1]})

cgram = Clustergram.from_data(data, labels)
cgram.plot();
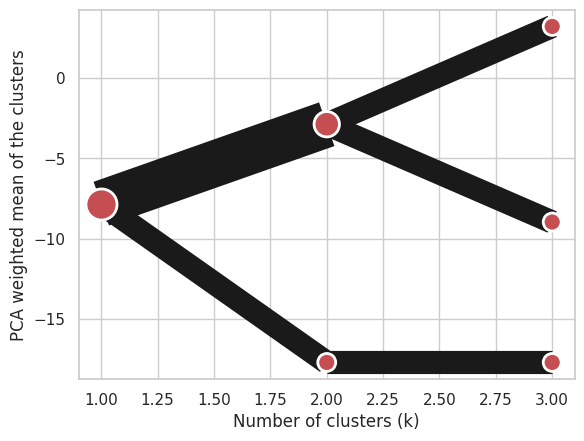
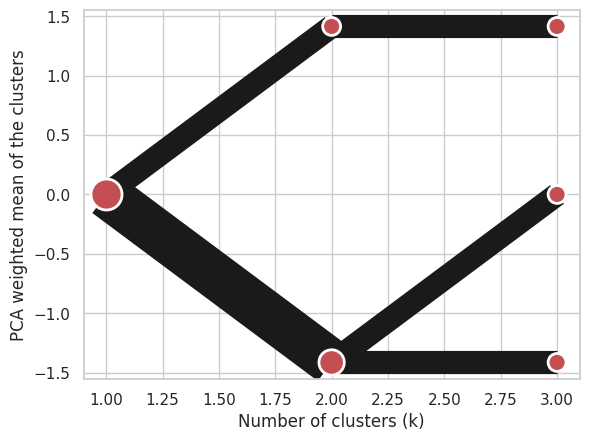
Using Clustergram.from_centers based on explicit cluster centers.:
labels = pandas.DataFrame({1: [0, 0, 0], 2: [0, 0, 1], 3: [0, 2, 1]})
centers = {
            1: numpy.array([[0, 0, 0]]),
            2: numpy.array([[-1, -1, -1], [1, 1, 1]]),
            3: numpy.array([[-1, -1, -1], [1, 1, 1], [0, 0, 0]]),
        }
cgram = Clustergram.from_centers(centers, labels)
cgram.plot(pca_weighted=False);
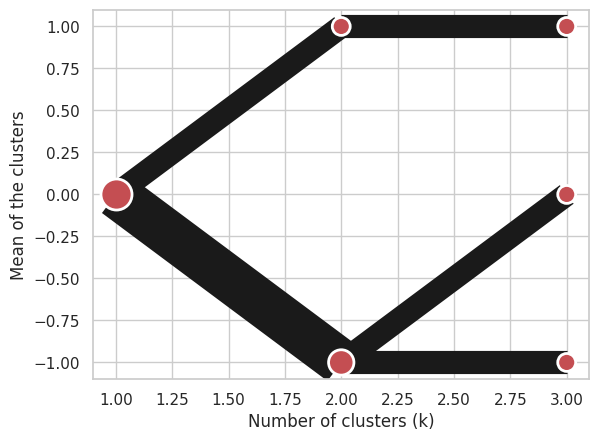
To support PCA weighted plots with clustergram created from centers you also need to pass data:
labels = pandas.DataFrame({1: [0, 0, 0], 2: [0, 0, 1], 3: [0, 2, 1]})
centers = {
    1: numpy.array([[0, 0]]),
    2: numpy.array([[-1, -1], [1, 1]]),
    3: numpy.array([[-1, -1], [1, 1], [0, 0]]),
}
data = numpy.array([[-1, -1], [1, 1], [0, 0]])
cgram = Clustergram.from_centers(centers, labels, data=data)
cgram.plot(pca_weighted=True);