Clustering methods#
Clustergram offers three backends for the computation - scikit-learn and scipy which use CPU and RAPIDS.AI cuML, which uses GPU. Note that all are optional dependencies but you will need at least one of them to generate clustergram.
Scikit-learn, SciPy and RAPIDS cuML backends#
Let’s load the data on Palmer penguins dataset. See the Introduction for its overview.
import seaborn
from sklearn.preprocessing import scale
from clustergram import Clustergram

df = seaborn.load_dataset('penguins')
data = scale(df.drop(columns=['species', 'island', 'sex']).dropna())

seaborn.set(style='whitegrid')
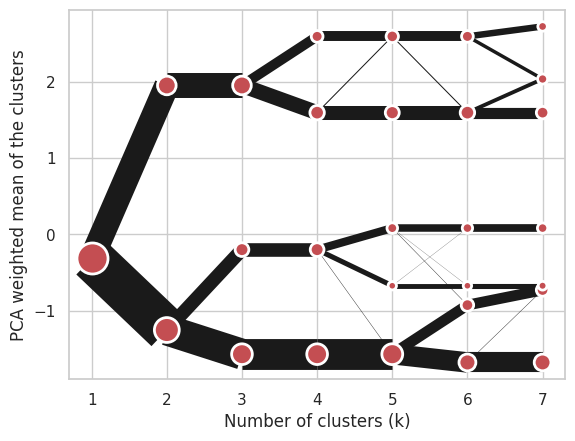
Using scikit-learn (default):
cgram = Clustergram(range(1, 8), n_init=10, backend="sklearn")
cgram.fit(data)
K=1 skipped. Mean computed from data directly.
K=2 fitted in 0.142 seconds.
K=3 fitted in 0.052 seconds.
K=4 fitted in 0.056 seconds.
K=5 fitted in 0.049 seconds.
K=6 fitted in 0.053 seconds.
K=7 fitted in 0.068 seconds.
Clustergram(k_range=range(1, 8), backend='sklearn', method='kmeans', kwargs={'n_init': 10})
Using cuML:
cgram = Clustergram(range(1, 8), backend='cuML')
cgram.fit(data)
cgram.plot();
data can be all data types supported by the selected backend (including cudf.DataFrame or cupy.ndarray with cuML backend).
Supported methods#
Clustergram currently supports K-Means, Mini Batch K-Means, Gaussian Mixture Model and SciPy’s hierarchical clustering methods. Note tha GMM and Mini Batch K-Means are supported only for scikit-learn backend and hierarchical methods are supported only for scipy backend.
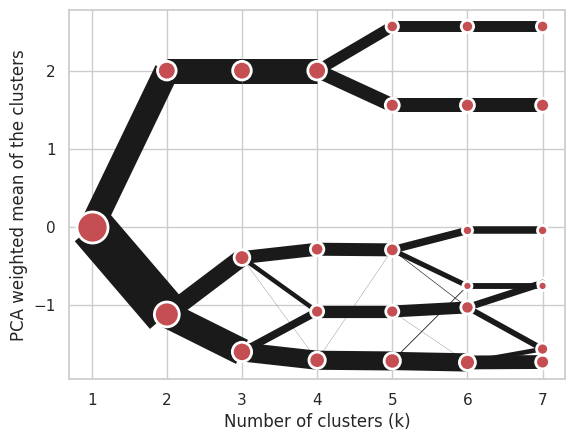
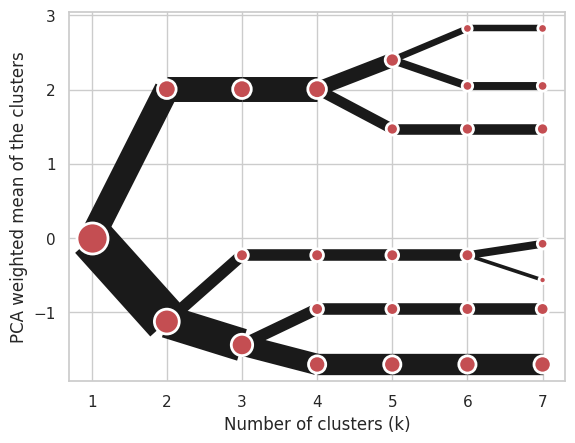
Using K-Means (default):
cgram = Clustergram(range(1, 8), n_init=10, method='kmeans')
cgram.fit(data)
cgram.plot();
K=1 skipped. Mean computed from data directly.
K=2 fitted in 0.055 seconds.
K=3 fitted in 0.066 seconds.
K=4 fitted in 0.046 seconds.
K=5 fitted in 0.052 seconds.
K=6 fitted in 0.058 seconds.
K=7 fitted in 0.065 seconds.
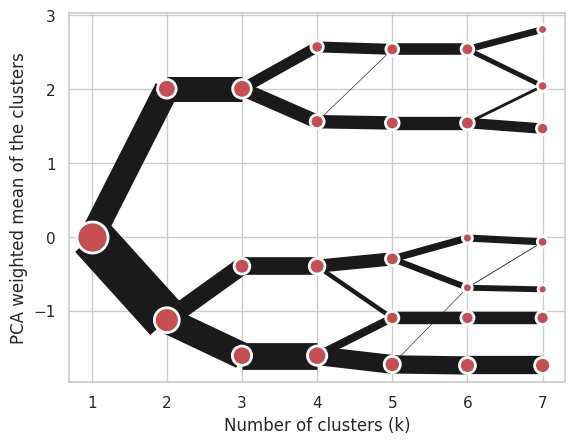
Using Mini Batch K-Means, which can provide significant speedup over K-Means:
cgram = Clustergram(range(1, 8), n_init=10, method='minibatchkmeans', batch_size=100)
cgram.fit(data)
cgram.plot();
K=1 skipped. Mean computed from data directly.
K=2 fitted in 0.071 seconds.
K=3 fitted in 0.070 seconds.
K=4 fitted in 0.071 seconds.
K=5 fitted in 0.054 seconds.
K=6 fitted in 0.060 seconds.
K=7 fitted in 0.066 seconds.
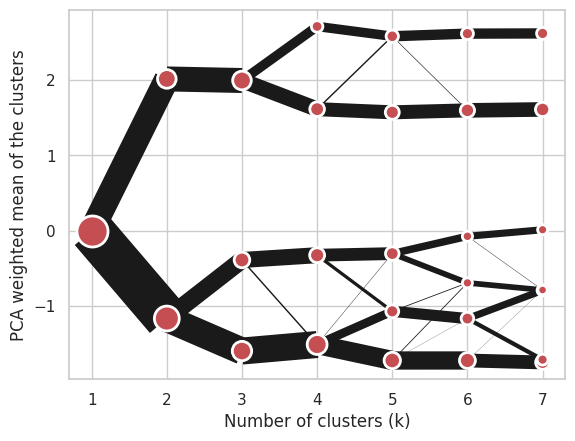
Using Gaussian Mixture Model:
cgram = Clustergram(range(1, 8), method='gmm')
cgram.fit(data)
cgram.plot();
K=1 fitted in 0.020 seconds.
K=2 fitted in 0.024 seconds.
K=3 fitted in 0.026 seconds.
K=4 fitted in 0.030 seconds.
K=5 fitted in 0.026 seconds.
K=6 fitted in 0.031 seconds.
K=7 fitted in 0.029 seconds.
Using Ward’s hierarchical clustering:
cgram = Clustergram(range(1, 8), method='hierarchical', linkage='ward')
cgram.fit(data)
cgram.plot();
Manual input#
Alternatively, you can create clustergram using from_data or from_centers methods based on alternative clustering algorithms.
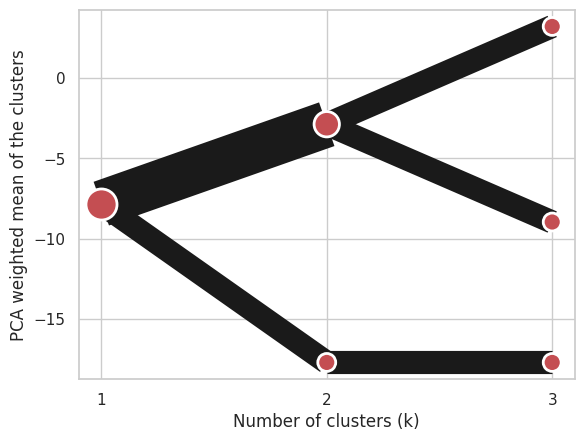
Using Clustergram.from_data which creates cluster centers as mean or median values:
import numpy
import pandas

data = numpy.array([[-1, -1, 0, 10], [1, 1, 10, 2], [0, 0, 20, 4]])
labels = pandas.DataFrame({1: [0, 0, 0], 2: [0, 0, 1], 3: [0, 2, 1]})

cgram = Clustergram.from_data(data, labels)
cgram.plot();
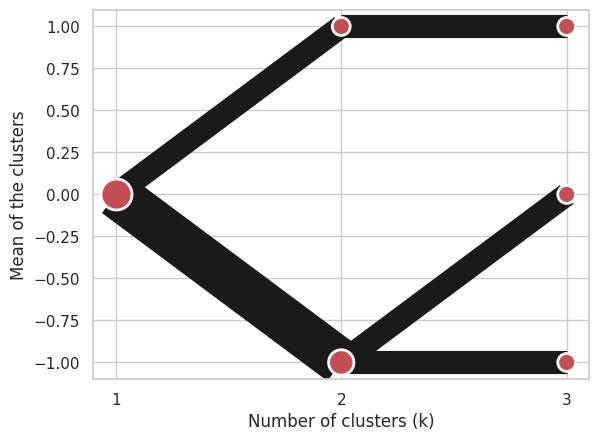
Using Clustergram.from_centers based on explicit cluster centers.:
labels = pandas.DataFrame({1: [0, 0, 0], 2: [0, 0, 1], 3: [0, 2, 1]})
centers = {
            1: numpy.array([[0, 0, 0]]),
            2: numpy.array([[-1, -1, -1], [1, 1, 1]]),
            3: numpy.array([[-1, -1, -1], [1, 1, 1], [0, 0, 0]]),
        }
cgram = Clustergram.from_centers(centers, labels)
cgram.plot(pca_weighted=False);
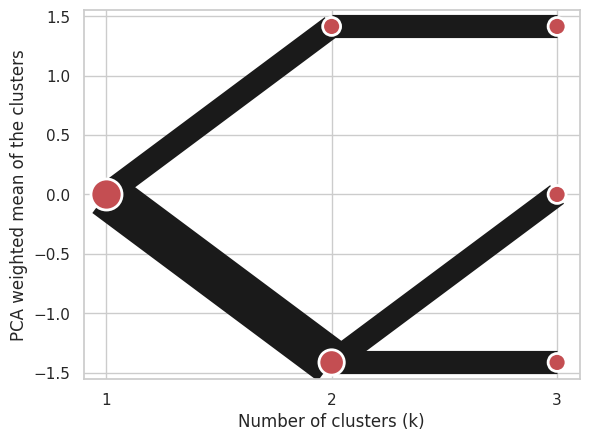
To support PCA weighted plots with clustergram created from centers you also need to pass data:
labels = pandas.DataFrame({1: [0, 0, 0], 2: [0, 0, 1], 3: [0, 2, 1]})
centers = {
    1: numpy.array([[0, 0]]),
    2: numpy.array([[-1, -1], [1, 1]]),
    3: numpy.array([[-1, -1], [1, 1], [0, 0]]),
}
data = numpy.array([[-1, -1], [1, 1], [0, 0]])
cgram = Clustergram.from_centers(centers, labels, data=data)
cgram.plot(pca_weighted=True);